Blog Archive

Friday, September 28, 2012

Shell resumes drilling in Chukchi: walruses haul out on Alaska's shore


In Alaska's Chukchi Sea: Shell Resumes Offshore Drilling as Nearby Walruses are Forced Onshore


The story of this year's Arctic sea ice decline did not end on 16 September when the sea ice reached its official minimum extent for the Arctic overall (see "An Unprecedented Planetary Distress Signal": Arctic Sea Ice Extent Bottoms Out at a Record Low, WWF Climate Blog, 19 September 2012). The decline has continued in the Chukchi Sea -- with momentous consequences. While the National Ice Center indicated that a large "marginal ice zone" was present north of Alaska on 16 September, that zone continued to decline and on 24 September the marginal ice zone had been entirely replaced by open water. The lack of sea ice allowed Royal Dutch Shell Alaska to resume drilling in the Chukchi on 24 September, after ice forced the company to suspend drilling on 10 September. In contrast, the lack of sea ice also has compelled a growing number of walruses nearby at Hanna Shoal to abandon that preferred feeding area and to swim towards land where they are hauling-out. As in 2007, 2009, 2010 and 2011, it now appears likely that we again will see large numbers of walruses huddled along Alaska's beaches, in iconic images that will starkly illustrate the massive disruption that is occurring in the Arctic as the region rapidly warms.
Above (click to enlarge): Hanna Shoal (near top middle of map), a highly productive shallow area favored by walruses, is about 80 nautical miles from the closest land and about 140 nautical miles from Point Lay. The hatched areas to the south and southwest of Hanna Shoal are oil leases. Among them is the "Burger prospect" around 25 miles to the southwest of the shoal, where Shell is presently drilling. Source: University of Texas Center for Research in Water Resources.
Just a month ago, large numbers of walruses were being sighted in the Hanna Shoal area.  Most of the walruses were females and their offspring (most of the males haul out elsewhere in Alaska).  Observers of the Chukchi Offshore Monitoring in Drilling Area (COMIDA) marine mammal aerial survey project reported seeing nearly 1,800 walruses on 21 August.  The U.S. Coast Guard icebreaker Healy also was sailing through the area on a scientific mission around that time.  The crew and scientists on some days sighted hundreds of walruses hauled out on the sea ice or swimming in the water.   Among the walruses in the area were 40 that had been tagged with radio transmitters earlier this year, and monitored on a daily basis by the U.S. Geological Survey (see the USGS Walrus radio-tracking in the Chukchi Sea 2012 page).
Above (click for larger version): Walruses -- nearly half of which are smaller young walruses -- hauled out on remaining sea ice in the Hanna Shoal area on 19 August 2012. The photo was taken by BMCM Timothy Sullivan, U.S. Coast Guard. He was aboard the USCGC Healy which was on a research cruise in the Chukchi Sea, including Hanna Shoal. Source: BMCM Timothy Sullivan, U.S. Coast Guard.
Overall Arctic sea ice extent continued to decline until 16 September, when the National Snow and Ice Data Center indicated that it had reached its minimum extent for the year (see "An Unprecedented Planetary Distress Signal": Arctic Sea Ice Extent Bottoms Out at a Record Low, WWF Climate Blog 19 Sep 2012). As the figure below indicates, there was at that time a "marginal ice zone" (shown in yellow) in the area of Hanna Shoal off the Alaska coast. The walruses on the Alaska side of the Chukchi were concentrated on that remaining ice, including all the walruses tagged and monitored by the USGS.
Above (click on map for larger version): Sea ice conditions in the Chukchi sea on 16 September 2012, the day of the 2012 Arctic sea ice minimum. At the time a marginal sea ice zone remained off the coast of Alaska over Hanna Shoal.  Yellow indicates marginal sea ice and red indicates areas where 8/10 or more of the surface is sea ice.  Source: National Ice Center.
But since 16 September, the marginal ice zone in the Hanna Shoal area has continued to decline and on 24 September the National Ice Center indicated for the first time in 2012 that the marginal ice zone was gone and designated the entire area as open water, as shown in the map below.
Above (click on map for larger version): Sea ice conditions in the Chukchi sea on 24 September 2012. For the first time in 2012, the National Ice Center showed no marginal sea ice zone over Hanna Shoal. National Ice Center.  Yellow indicates marginal sea ice and red indicates areas where 8/10 or more of the surface is sea ice. Source: National Ice Center.
On the same day (24 September) that the National Ice Center indicated an absence of marginal sea ice in the Chukchi Sea off of Alaska, Shell's Noble Discoverer drillship [link includes current coordinates] resumed drilling in the Chukchi near Hanna Shoal. But simultaneously, the walruses that had thus far managed to find enough ice over Hanna Shoal were compelled to head for the Alaskan shoreline. Among them were walruses tagged with radio transmitters that are monitored by the USGS. Where the tagged walruses had previously all been tightly concentrated over Hanna Shoal, on 24 September the USGS Walrus Tracking Map indicated that one of the tagged walruses already had left the shoal and was along the Alaska coast. In the days since then, more of the tagged walruses have moved to haulouts on land along Alaska's shoreline, especially near Point Lay.  Others still are swimming toward land.  See the map below for 27 September at 4 am (0400 hrs), where the purple dots show the locations of tagged walruses and the purple lines show their previous positions.  Note that when the tagged walruses are close to each other, only a single dot may be visible.
Above: Map showing the positions on 27 September 2012 (purple dots) and past tracks (purple lines) of the walruses tagged with radio transmitters and monitored by the USGS (40 walruses were originally tagged).  Note that when the tagged walruses are close to each other, only a single dot may be visible.  A week earlier, when still some marginal sea ice remained, the walruses were concentrated in the purple area roughly between N71.5o and N72.0o.
WWF has received confirmation from observers in Alaska that the walruses indeed are hauling-out on land along the Alaskan coast of the Chukchi.  We can expect in coming days and weeks to witness the kind of scene we've seen in recent years marked by dramatically low sea ice extent: thousands or even tens of thousands of walruses packed together in conditions that are difficult  and  -- particulary for the smaller, younger walruses -- dangerous.  The photos below show the haulouts near Point Lay, Alaska, in 2011.  Observers estimated that 20,000 walruses hauled out there. 
Above and below: During COMIDA flight 235 [PDF] on 19 August 2011, observers reported " Approximately 10,000 walruses were observed hauled out on land slightly north of Point Lay" (click on image for larger high resolution image).  Less than a week later, COMIDA observers on 24 August estimated that the number of walruses had doubled to roughly 20,000.  Source: Rebecca Shea (National Marine Mammal Laboratory, Alaska Fisheries Science Center, National Marine Fisheries Service, National Oceanic and Atmospheric Administration).
Online Resources:
Postings on the WWF Climate Blog about walruses and the haul-outs in 2009, 2010 and 2011:  see link:

Charles Monnett vindicated in BOEM witch hunt


DROWNED POLAR BEAR PROBE CLOSES WITH A WHIMPER — 

Unrelated Disclosures from 2007 and 2008 Dredged Up in Questionable Reprimand

by Kirsten Stade, PEER, September 28, 2012

Washington, DC — No charges will be brought against the federal scientist regarding his high-profile research on polar bears, despite a two-and-a-half year investigation, according to documents released today by Public Employees for Environmental Responsibility (PEER).   Instead, he has received a letter of reprimand for allegedly improper disclosures back in 2007 and 2008 which helped reveal that Bush administration Arctic offshore drilling reviews illegally suppressed adverse environmental consequences.

Up until July 2011, Dr. Charles Monnett had directed a multi-million dollar portfolio constituting a majority of research on Arctic wildlife and ecology conducted for the U.S. Bureau of Ocean Energy Management (BOEM).  He was temporarily suspended due to an Interior Office of Inspector General (OIG) investigation into a polar bear research contract managed by Dr. Monnett.  The OIG probe, which began in March 2010, also centered on a 2004 paper authored by Dr. Monnett in the peer-reviewed journal Polar Biology concerning observations of drowned polar bears following a storm.

The final IG report, delivered to BOEM three months ago, is slated for imminent release.  On Friday, September 27, 2012, BOEM informed Dr. Monnett that no action would be taken against him based on “findings made by the OIG in its report regarding your conduct” with the exception of a series of “improper disclosures of internal, deliberative government documents to a non-governmental entity” back in 2007 and 2008.   These disclosures had nothing to do with polar bear research but they embarrassed the agency and were, according to the letter of reprimand, “cited by the U.S. Court of Appeals for the Ninth Circuit in making decisions to vacate BOEM’s approval of the Shell exploration plan” for Arctic waters.

“We are pleased this misguided witch hunt is finally stumbling to a conclusion,” stated PEER Executive Director Jeff Ruch, whose organization is providing legal representation to both Dr. Monnett and his co-author of the drowned polar bear paper, Dr. Jeffrey Gleason.  “We will push to learn how this abusive probe got started and why it was sustained.  We expect Dr. Monnett to return to work as a scientist.”

Dr. Monnett was returned from suspension after a month and placed on detail pending the outcome of the OIG investigation with duties largely unrelated to his previous work.  He has been verbally informed that he will return to scientific work.  The letter of reprimand, a low level of discipline, will be placed in his personnel file for two years and then “be removed…and destroyed” if he commits no further “misconduct during this period.”  The reprimand may be challenged through civil service and ultimately court appeals.

“We are amazed that Dr. Monnett would be reproved for revealing that his agency was wrongfully withholding information,” Ruch added, noting that such disclosures are protected by the Whistleblower Protection Act, among other laws.  “For his actions, Chuck Monnett deserves a citation, not a reprimand.  However, if after years of investigation, these stale, stilted charges are the only things these jokers could dig up, Dr. Monnett must be an exemplary public servant.” 

The OIG report will become final 90 days from delivery to BOEM or when the agency acts on the report’s recommendations for administrative action.  According to the OIG, today its report becomes final.

Arctic Ice “Rotten” to the North Pole, scientist says

Arctic Ice “Rotten” to the North Pole, scientist says 

by Margaret Munro, The Vancouver Sun, September 21, 2012

When David Barber first headed to the Arctic in the 1980s, the ice would typically retreat just a few a kilometres offshore by summer’s end.

Now he and his colleagues have to travel more than 1,000 kilometres north into the Beaufort Sea to even find the ice.

And it’s nothing like the thick, impenetrable ice of Arctic lore.

This year the ice is “rotten” practically all the way to the North Pole, says Barber, a veteran Arctic researcher and director of the Centre for Earth Observation Science at the University of Manitoba.

“The multi-year ice, what’s left of it, is so heavily decayed that it’s really no longer a barrier to transportation,” he says, explaining how melt ponds have left much of the ice looking like Swiss cheese.

“You could have taken a ship right across the North Pole this year,” says Barber, whose research team was involved in a 36-day research cruise in the Beaufort on a Canadian Coast Guard ship.

The Arctic ice loss this summer shattered the record set in 2007. It hit the low point last weekend, covering 3.41 million square kilometers, or 24 per cent, of the Arctic Ocean, according to the U.S. National Snow and Ice Data Center, which has been tracking the ice with satellites since the late 1970s.

This year’s minimum is nearly 50-per -cent lower than the 1979 to 2000 average.

While the ice loss documented by the NSIDC is record-setting, Barber says the reality in the Arctic is ever worse.

The U.S. numbers are about “a 15% over-estimation of how much ice is actually there,” says Barber. That’s because satellites have trouble discerning ice conditions, he says, and will count heavily decayed ice as solid.

Regardless of who is doing the counting, he and other scientists consider the ice loss remarkable. And they say the impact will be felt far beyond the Arctic.

“It’s a globally significant change on our planet,” Barber said in an interview.

Many expect the Arctic could be “seasonally ice free” in the summer within a decade.

“I’d say 2020, plus or minus five years,” says Barber.

At that point the planet will be without its icy dome for the first time in eons.

A recent study that looked back 1,450 years indicates the current Arctic ice melt has already eclipsed the medieval warm period of about 1,000 years ago.

“The level that we are at now is unprecedented over the last 1,450 years,” says Barber. “And as far as we know we have to go back over a million years to find a period when the Arctic was seasonally ice-free in the summer.”

The Arctic melt is also happening faster than at any time in the planet’s past, says Barber, noting that the geological and historical records indicate it took tens of thousands of years to move to a seasonally-ice-free Arctic in the past.

“Now we are getting there in tens of years, not tens of thousands of years,” he says. “And we don’t know how the Earth is going to respond because we have never seen such a rapid change before.”

Environmentalists and scientists were quick this week to call for cuts in greenhouse gas emissions to slow the global warming that is melting the ice.

James Hansen, a prominent and outspoken NASA climate scientist, said the Arctic melting shows the risks society is running by failing to limit emissions produced by burning oil, coal and gas.

“The scientific community realizes that we have a planetary emergency,” said Hansen. “It’s hard for the public to recognize this because they stick their head out the window and don’t see that much going on.”

“We can see very viscerally in the ice how warming temperatures are changing the Earth’s environment,” Walt Meier, of U.S. NSIDC told a media briefing this week.

He and other researchers say the Arctic melt is just the tip of the iceberg.

Rising global temperaturess are also transforming northern ecosystems, melting permafrost and shattering ancient ice shelves. Giant icebergs from the disintegrating shelves are now sailing through Canada’s Beaufort Sea, creating a new hazard for oil rigs, says Barber, whose team is involved in national and international efforts to get a read on the new Arctic reality and it implications.

Global warming is also altering the oceans. More warm, salty water from the North Atlantic is flowing in the Arctic, and may be helping speed up ice melt.

Another concern is rising sea level. Arctic ice is already in the ocean so does not raise sea level when it melts. But the extra heat being absorbed by the Arctic Ocean due to the ice loss appears to be accelerating melting of the Greenland ice sheet, which does raise sea levels.

The growing expanse of open Arctic water, which traps a lot more of the sun’s heat than reflective ice, is also altering polar storms and winds, says Barber. And this in turn may be linked to the increasingly strange and extreme weather seen from New Orleans to Newfoundland.

Statistical evidence suggests the changes in the Arctic are slowing the jet stream and pushing it further south, leading to more “persistent” climate patterns – be it rain, drought or sunshine, he says. The challenge now is to understand the physical mechanism.

”Our society, our civilization and how we live our lives – it’s all predicated on a stable climate system,” says Barber, who notes that the planet has undergone abrupt climate change in the past and could do so again.

“The take-home message for people is we are running an experiment with Earth’s climate system,” says Barber, and greenhouse gases are contributing to enormous change – like melting Arctic ice – that is happening much faster than anticipated.
http://www.vancouversun.com/touch/technology/story.html?id=7279382

"Spring snow cover extent reductions in the 2008-2012 period exceeding climate model projections," by Chris Derksen & Ross Brown, GRL (2012); doi:10.1029/2012GL053387


Geophysical Research Letters, doi:10.1029/2012GL053387
Spring snow cover extent reductions in the 2008-2012 period exceeding climate model projections
Key Points
  • N. Hemisphere spring snow cover extent reductions since 1967 are significant
  • Rate of June snow loss exceeds the rate of September sea ice loss (1979-2011)
  • Snow reductions since 2005 exceed an ensemble of CMIP5 simulations
Chris Derksen and Ross Brown
Abstract

Analysis of Northern Hemisphere spring terrestrial snow cover extent (SCE) from the NOAA snow chart Climate Data Record (CDR) for the April to June period (when snow cover is mainly located over the Arctic) has revealed statistically significant reductions in May and June SCE. Successive records for the lowest June SCE have been set each year for Eurasia since 2008, and in 4 of the past 5 years for North America. The rate of loss of June snow cover extent since 1979 (-21.5%/decade) is greater than the loss of September sea ice extent (-10.8%/decade) over the same period. Analysis of Coupled Model Intercomparison Project Phase 5 (CMIP5) model output shows the marked reductions in June SCE observed since 2005 fall below the zone of model consensus defined by +/-1 standard deviation from the multi-model ensemble mean.
Received 30 July 2012; accepted 9 September 2012.
Derksen, C. and R. Brown (2012), Spring snow cover extent reductions in the 2008-2012 period exceeding climate model projectionsGeophys. Res. Lett., doi:10.1029/2012GL053387, in press.

NOAA Administrator Dr. Lubchenco names new Deputy Under Secretary for Operations


June 1, 2012

Rear Admiral David Titley
Rear Admiral David Titley.
Download here. (Credit: U.S. Navy.)
It gives me great pleasure to announce Rear Admiral David Titley as the next Deputy Under Secretary for Operations (DUS/O) at NOAA. As NOAA’s Chief Operating Officer, Dr. Titley will be responsible for managing operations across NOAA’s entire portfolio and will serve as one of my key advisors on NOAA program and policy issues.
Dr. Titley brings to this position a wealth of knowledge and experience in leading large, complex organizations and directing major operations around the world. A naval officer since 1980, Rear Admiral Titley’s distinguished career has included seven deployments to the Mediterranean Sea, Indian Ocean, and Western Pacific region and multiple commands (Fleet Numerical Meteorological and Oceanographic Center, Naval Oceanography Operations Command, and Naval Meteorology and Oceanography Command). Shore tours include serving on the staff of the U.S. Commission on Ocean Policy and as the senior military assistant to the director of Net Assessment in the Office of the Secretary of Defense
In 2009, he assumed the duties of the oceanographer and navigator of the Navy, and in 2012, he became acting assistant deputy chief of Naval Operations for Information Dominance. Dr. Titley’s education includes a Bachelor of Science in meteorology from the Pennsylvania State University, a Master of Science in meteorology and physical oceanography, and a Ph.D. in meteorology, both from the Naval Postgraduate School. His dissertation focused on better understanding tropical cyclone intensification. He was elected a Fellow of the American Meteorological Society in 2009.
I couldn’t be more pleased that Dr. Titley will be joining our senior leadership team in July.
Dr. Jane Lubchenco
Under Secretary of Commerce for Oceans and Atmosphere
and NOAA Administrator

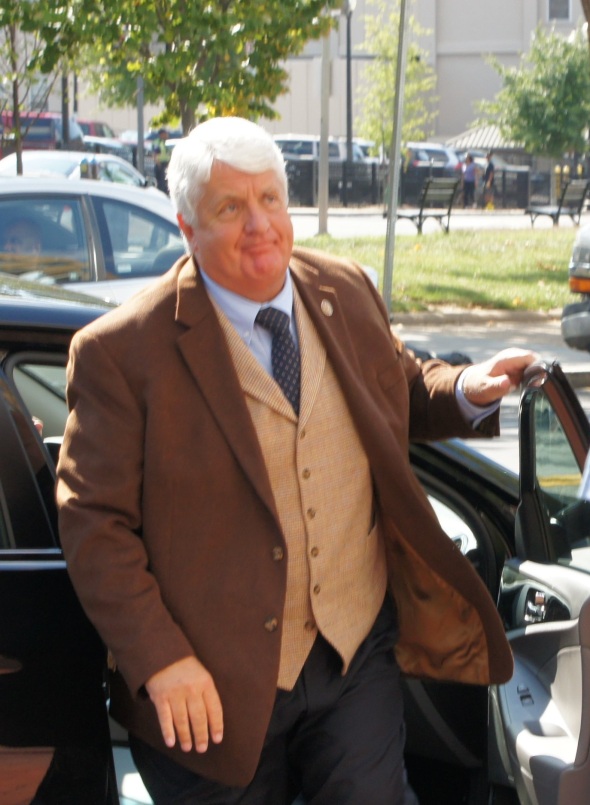
ALEC and Republican Study Committee Meet: Name that Representative!


Name that Representative! Republican Study Committee Meets with ALEC


from the Checks and Balances Project, September 28, 2012
On Friday, the Heritage Foundation sent security staff to confront the Checks and Balances Project (C&BP) when it attempted – from public property – to identify the high-profile lobbyists and members of Congress who were attending a closed-door meeting between the Republican Study Committee and the controversial American Legislative Exchange Council (ALEC). Heritage Foundation security staff attempted to physically block C&BP from photographing attendees.
C&BP is responding by launching an online “member identification” effort (see slideshow below) to get the help of others to identify which members of Congress the 164-member RSC chose to attend the meeting with ALEC, an organization under scrutiny because of its role as a “bill mill” for corporate special interest legislation.
Background
With solar and wind energy installing record amounts of power generation, the fossil fuel lobby is attacking vital clean energy policies. But, these attacks rarely come directly from an ExxonMobil or Koch Industries’ lobbyist. Instead, they are done through donations to groups, such as ALEC, Heritage Foundation and Americans for Prosperity, which work to undercut the Production Tax Credit and state renewable energy standards because they are “costly.”
But these groups tout themselves as “free market” groups, looking to cut government spending. We wanted to explore these groups’ willingness to push for cuts in the enormous amounts of taxpayer money that members of Congress give to the fossil fuel lobby through tax deductions, tax credits, cheap access to public property, pollution clean up, and government-funded R&D and general cheerleading.
The Checks & Balances Project sought not only to identify meeting attendees, but to ask ALEC Energy, Environment and Agriculture Task Force Director Todd Wynn basic questions about ALEC’s interest in devoting proportional effort to cutting wasteful government welfare to highly profitable, mature fossil fuel sectors.
The reaction we got at the Heritage Foundation was less than welcoming, though familiar to us from when we sought to ask basic questions of pro-gas, anti-clean energy pundit Robert Bryce of the fossil fuel-funded Manhattan Institute.
Over the past two weeks, the RSC of the House of Representatives has hosted at least two meetings with supposed “free market” groups like American Energy Alliance, ALEC and Heritage – all of which receive funding from fossil fuel interests.  These “free market” groups rarely, if ever, work to cut the far-larger government support given to the fossil fuel industry each year, and instead are focusing their attacks on clean energy even though taxpayers are forced to pay between $40 and $69 billion per year in fossil fuel welfare to the most profitable industry on the planet.
If we can identify which members of Congress attended the meeting, we can ask them about their interest in cutting wasteful fossil fuel subsidies first, given they are far larger than the cost of policies that support the growth of new clean energy sources.
Leave a comment if you recognize a Member of Congress!


Record Arctic Snow Loss May Be Prolonging North American Drought


Record Arctic Snow Loss May Be Prolonging North American Drought
  • by Brandon Keim, Wired, September 26, 2012l Author
Hudson Bay on April 6 (left) and June 5 (right), 2012. Image: NASA
Melting Arctic snow isn’t as dramatic as melting sea ice, but the snow may be vanishing just as rapidly, with potentially profound consequences for weather in the United States.
Across the Arctic, snow melted earlier and more completely this year than any in recorded history. In the same way ice loss exposes dark water to the sun’s radiant heat, melting snow causes exposed ground to heat up, adding to the Arctic’s already super-sized warming.
This extra heat retention appears to alter the polar jet stream, slowing it down and causing mid-latitude weather patterns to linger. It’s even possible that the ongoing North American drought, the worst since the Dust Bowl of the 1930s, was fueled in part by climate change in the Arctic, making it a preview of this new weather pattern’s ripple effects.
“In the past, whatever happened in the Arctic stayed in the Arctic. But now it seems to be reaching down from time to time in the mid-latitudes,” said climatologist James Overland of the National Oceanographic and Atmospheric Administration. “When you combine the new influence of the Arctic with other effects, such as El Niño, we’re seeing the more extreme weather events.”
Over the last several weeks, public attention has been seized by the disappearance of ice in the Arctic Ocean, which in September covered a smaller area than at any other time in the climate record, a fitting exclamation point to its 50% decline since the late 1970s.
Variation from the post-1967 historical norm in June snow cover, June 2012. Dark orange corresponds to between 75 and 100 percent below average. Image: Rutgers University Climate Lab
In June, Arctic snow cover also reached historic minimums. At the time, the news received little attention. Though the snow has retreated for several decades, and has even declined as precipitously as the sea ice, freshly exposed ground simply lacks the visual impact of open water.
It’s also harder to put the decline into context: Scientifically useful Arctic snow records only date back to the beginning of satellite photography in the 1960s, a relatively short period of time. The role of snowmelt has received less research attention than sea ice, and scientists are just starting to understand the interactions between climate patterns in the Arctic and lower North America.
“This is cutting-edge science,” said climatologist David Robinson, who runs the Global Snow Lab at Rutgers University. The research is maturing, however, and the implications are troubling.
To understand what snow loss could do, it’s instructive to study what happens when sea ice melts, a process described in a Geophysical Research Letters paper published in March by climatologists Jennifer Francis of Rutgers University and Stephen Vavrus of the University of Wisconsin-Madison.
As the sea, now deprived of its reflective cover, absorbs heat, surface temperatures rise. That heat returns to the atmosphere during fall and winter, reducing the difference in temperature between the Arctic and latitudes below. This difference is what propels the northern hemisphere’s polar jet stream, the globe-spanning atmospheric current that pushes vast amounts of cold air south and warm air north.
“Think of it like a hill. Normally the Arctic is much colder than areas to the south. Because warm air takes up more space than cold air, the atmosphere to the south is thicker. If you’re sitting on top of one of these layers, you’ll slide down the hill to the Arctic. Earth’s spin turns you towards the right, and that’s what generates the jet stream,” explained Francis. “If you’re warming the Arctic more, the hill is less steep, and you won’t roll as fast.”
The jet stream loses speed. As this happens, say Francis and Vavrus, its path also changes, dipping far to the south and reaching to the north. This is what happens in fall and winter after Arctic sea ice melts in the summer. In the summer, after snow melts in spring, “we think a similar mechanism is going on with the snow,” Francis said. “If you lose all the snow earlier on high latitude land in the spring, when the sun is strongest, you’ve got dark soil exposed earlier, warming up earlier. It’s another way to make the Arctic warm faster than the rest of the hemisphere.”

For now, Francis says, this is still a hypothesis, albeit supported by North American climate patterns in recent years and similar observations from Siberia. “There’s just basic physics behind it. We’re dealing with a very different energy budget up in polar regions than previously, because we’re exposing the land earlier in the season to the warming rays of the sun,” Robinson said. “The physics are indisputable.”
Indeed, it’s reasonable to speculate about the effects of the jet stream’s new patterns — and that’s where things get really interesting. In anotherGeophysical Research Letters paper now in press, Francis and Overland describe how atmospheric pressure patterns generated by extreme spring snowmelts in the last several years seem to have channeled warm air across the central Arctic Ocean.
The winds accelerate the sea ice’s melt and push it into the Atlantic Ocean. They also seem to have hastened Greenland’s ice sheet melt, which reached unprecedented rates this July. “The winds used to be light,” said Overland. “Now we have more steady winds that blow from the Bering Strait across the north pole and out into Atlantic.”
The connection between snowmelt and the new winds hasn’t been directly proven, Overland said, but the pieces fit. “In the last three years, we’ve had a real major loss in snow cover. That’s why we think there may be a tie between the loss of snow, higher atmospheric pressure and the changes in the winds,” he said.
As the polar jet stream slows and meanders, the regional weather patterns it influences could end up persisting longer than usual, rather than being carried away by the stream. Whether this would extend to temperate latitudes during the summer isn’t certain, said Francis, since the polar jet stream tends to be weaker in summer than in winter, but it’s plausible.
“It’s harder to show in summer, because the waves are more amorphous, but the same mechanisms should happen,” Francis said. If so, that could at least partly explain why the North American drought, which started in the spring, is so severe. In a year without such an extreme Arctic snowmelt, it might have been a dry spell dispelled by the jet stream. Instead it stuck around.
Northern hemisphere snow coverage, in millions of square kilometers, as compared to the post-1967 average. Image: Rutgers University Climate Lab
More research is needed to be certain this hypothesized cascade of snowmelt, jet stream changes and drought lockdown in fact happened — Overland cautioned that “it’s very, very difficult to say” — but it raises the possibility that the Arctic climate is even more intertwined with lower-latitude weather than most researchers thought.
If so, extreme lower-latitude weather events will become more likely. “As the waves work more slowly, the weather wherever you happen to be will tend to change more slowly,” Francis said. “If that goes on long enough, you have extreme weather. If you have a cold snap for a day or two, it’s not a big deal. If it goes on for weeks, it’s an event. Same with drought.”
The next question is whether the extreme Arctic snowmelt is a result of human-caused warming. According to Francis, that’s likely the case. “There’s nothing else that can explain it. It’s so dramatic. It’s almost certainly mostly anthropogenic,” she said.
Robinson said climate scientists generally agree that some Arctic warming is human-forced, but would disagree as to precisely how much. As for himself, “I believe we see the fingerprint of man in it,” he said, saying there is a “preponderance of evidence” that greenhouse gases are to blame. “We see multiple changes going on there. These things are happening just as the models suggest they should happen.”
Even a small amount of unnatural Arctic warming is a problem. “That little bit of warming starts all these physical processes, like loss of snow and ice, so you start absorbing more solar energy rather than reflecting it to space. That amplifies the signal,” said Overland, who says people are responsible for an Arctic uptick of about 2 degrees Fahrenheit. “It’s not just the initial warming. It’s the cascade of events.”
Some researchers have also linked the drought to an intersection of human-caused warming in the Indian Ocean, where warmer temperatures are historically associated with mid-latitude droughts, and natural La Niña cooling in the central Pacific, which generates dry spells in southern North America. Add this “perfect ocean for drought” to the Arctic snowmelt, and the combination may have been catastrophic.
That, of course, remains a hypothesis. “I wish we had years more data. I wish we had models that could give us order-of-magnitude improvements in temporal and spatial resolution. But that’s science. You put the pieces together, and you conduct your investigation,” Robinson said.
In a few years, scientists may have a better idea. In the meantime, the Arctic will continue to melt. “We are seeing changes that most of us never imagined we would see in our careers,” Robinson continued. “People talk about the new normal. There’s nothing normal about this. It’s going to continue to change.”

Hundreds deliver Romney climate change petition with a simple message: “Denial is not a climate policy: Stop climate change now.”


350.org, September 28, 2012
BOSTON — Staffers at Gov. Mitt Romney’s Boston campaign headquarters today were met by concerned citizens displaying signs like “Denial is not an energy policy,” while the candidate received 52,864 signatures to a petition asking him what his positions are on climate change.
Scores of people joined in the petition delivery–including author and activist Bill McKibben, local faith leaders, and students – all concerned over recent statements by Romney that hinted that he thinks climate change is more of a joke than a serious issue.
“With a melting arctic and a parched Midwest, it’s high time to stop smirking about climate change, like Mitt Romney did at his convention, and start addressing how we will deal with this massive crisis,” said McKibben.
Two other events today highlighted growing concern over Romney’s lack of a strategy to deal with a warming planet. In North Carolina, dozens of fishermen, canoers, and recreational boaters formed a flotilla to oppose the candidate’s plans for offshore oil drilling there; and in Pueblo, CO, about a dozen people gathered outside the Vestas wind turbine factory to highlight the Romney’s lack of support for continuing the tax credit for wind power manufacturing.
In recent months, Gov. Romney has done much to fuel speculation that he does not take climate change seriously.
  • He released a 21-page energy plan that contains no references to climate change while promising increased natural gas development, oil drilling, and rollback of environmental safeguards. (1)
  • During his Republican National Convention speech he joked about climate change, and repeated the joke on NBC’s “Meet the Press.” (2)
  • He calls cap and trade, a Republican creation, a “radical feel-good” policy that would have “devastating results for people across the planet.” (3)
  • He has said that on Day 1 of his administration he would approve the Keystone XL pipeline, which would bring 900,000 barrels of the world’s dirtiest oil, tar sands crude from Canada, down through the US for export. (4)
“Climate change is the most pressing spiritual and moral issue of our time.  Unless we stop pouring greenhouse gas pollution into the atmosphere as if it were an open sewer, we will leave a ruined world to our children and condemn the poor to unimaginable hardship,” said the Rev. Margaret Bullitt-Jonas of Grace Episcopal Church in Amherst.
Photos of today’s events will be available in 1 hour at http://www.flickr.com/350org/
CONTACT: Daniel Kessler, 350 Action Fund 1-510-501-1779; daniel@350actionfund.org

Thursday, September 27, 2012

Summer of Extremes: Roundup of U.S. Records by Richard Somerville and Jeff Masters


Summer of Extremes: Roundup of U.S. Records

An Update from Climate Communication, September 25, 2012

Expert Reviewers:

With oppressive heat waves, devastating droughts, ravaging wildfires, and hard-hitting rainstorms, the summer of 2012 has been one for the record books. Thousands of precipitation and temperature records were broken, plaguing almost all of the contiguous United States this season and underscoring the connection between climate change and increasingly frequent and intense extreme weather. With climate change, we’ve set the stage for precisely this kind of extreme weather, and unfortunately, our changing climate threatens to alter summers to come.
It is important to note that as the planet continues to warm, new high temperature records and some other types of extremes will increasingly occur, but where they occur in a given year will not be predictable due to natural modes of climate variability. Extreme weather pummeled the United States this summer, but the next few years might see the most dramatic extremes occurring elsewhere around the world. Regardless, record-breaking high temperatures, droughts, wildfires, and heavy downpours are all signs of new extreme weather patterns that we can expect to see more of in a warming world, both domestically and abroad.
Here’s a roundup of weather events during the record-breaking summer of 2012:

Heat

  • From June to August 2012, nearly 10,000 daily high temperature records were broken compared to just over 1,400 daily low-temperature records throughout the same 3-month period.
  • July 2012 was the hottest month in U.S. history.
  • JuneAugust 2012 was the 3rd hottest on record for the continental U.S., 2.3 degrees F above the 20th century average.
  • Wyoming and Colorado each had their hottest summer on record; Nevada was record hot for August.
  • Approximately 6% of the 300 largest U.S. cities set their all-time heat records in 2012. The only year with more all-time heat records than 2012 is 1936, when 20% of U.S. cities set their all-time heat records.
  • Remarkably, 50% of the contiguous U.S. had maximum temperatures that were in the highest 10% historically during summer 2012. 
  • More than 80 million people—about 10 million more than in 2011—experienced 100°F or higher temperatures. Oklahoma City had 18 straight days where temperatures reached 100° or greater, including three days in a row that were 112 °F, exacerbating wildfires and drought in the state. The only heat wave in Oklahoma history that compares to the August 2012 heat wave occurred during the great Dust Bowl summer of 1936, the hottest summer in U.S. history. Oklahoma City experienced a record streak of 22 straight days with a temperature of 100 °F or hotter that year.
  • The unusually hot summer helped JanuaryAugust be the warmest such period in U.S. history. Even if SeptemberDecember temperatures rank in the coldest 1/3 of historical temperatures, 2012 will still set a record for the warmest year in U.S. history (since record-keeping began in 1895).

Drought

  • More than 2/3 of the country experienced drought throughout the summer of 2012, much of it classified as “severe to extreme.”
  • The percentage area of the U.S. experiencing top-10% drought conditions was 36%, which was second only to the summer of 1934 (57%).
  • The U.S. Department of Agriculture (USDA) declared a federal disaster area in more than half of all the counties in the U.S., mostly caused by drought. It was the largest disaster declaration ever made by the USDA.
  • The nation could face costs of up to $77 billion due to the 2012 drought, making it the 3rd costliest weather-related disaster since 1980, behind Hurricane Katrina and the drought of 1988.
  • July 2012 ranked 4th for the greatest percent area of the contiguous U.S. covered by moderate or greater drought and was the worst drought since 1954. Drought records go back to 1895.

Wildfires

  • JanuaryAugust 2012 broke the year-to-date record for most acreage burned by wildfires (6,888,342).
  • A total of 3 million acres burned from mid-July to the end of August 2012.
  • Summer 2012 is setting a record pace for Missouri wildfires, with more than 50 fires and more than 4,000 acres of public and private lands burned in the 3-month period. 
  • The WhitewaterBaldy Complex wildfire in southwestern New Mexico was the largest in state history. The previous record was set in 2011.
  • The Waldo Canyon Fire in Colorado caused the evacuation of more than 32,000 residents during the summer of 2012 and caused more than $352.6 million in damage. It holds the record for most destructive and expensive fire in Colorado state history.
  • The 8.5 million acres burned this year already puts 2012 in 5th place for biggest fire year since 1960, according to the National Interagency Fire Center. With over three months left in the year, 2012 will likely end as the 1st or 2nd biggest fire year in U.S. history for total acreage consumed.

Extreme Storms

West Nile

  • More than 2,100 cases of West Nile virus—including 92 deaths—were reported through early September of 2012, setting a record for highest human toll since the disease was first detected in the U.S. in 1999. The cases are projected to continue into the fall.

Summer of Extremes: Roundup of Global Records

Heat

  • Summer 2012 was the 3rd hottest summer on record globally, and land temperatures were the hottest on record.
  • The last time the world saw a cooler-than-average July was 1976.
  • June 2012 was the 4th hottest June, July was the 4th hottest July, and August 2012 was the 4th hottest August ever recorded for the entire planet.
  • August 2012 was the 330th consecutive month that the global temperature was above the 20th-century average.

Arctic Sea Ice Melt

  • In September 2012, Arctic sea ice reached the lowest level since satellite monitoring began more than 30 years ago. Half of the Arctic sea ice has disappeared, compared to the 1979–2000 average.
  • The new record is 18% below the earlier record set in 2007.
  • In early August 2012, the Greenland ice sheet melted to a 30-year low.
Climate change has shifted the odds, altered the natural limits, and increased the severity of certain kinds of extreme weather. As a result, we are witnessing an increase in record-breaking extreme weather events.