Blog Archive

Sunday, November 29, 2015

New NASA GRACE study shows Brazil’s drought deeper than thought – Southeast losing 56 trillion liters of water in each of the past three years

GRACE water storage anomaly data over Brazil for 2002-2014. Red and orange are areas with water losses; blues are gains. Graphic: Getirana, 2015 / NASA Goddard Media Studios / Journal of Hydrometeorology
by Chris Arsenault, 30 October 2015
TORONTO (Thomson Reuters Foundation) - New satellite data shows Brazil's drought is worse than previously thought, with the southeast losing 56 trillion liters of water in each of the past three years - more than enough to fill Lake Tahoe, a NASA scientist said on Friday.
The country's most severe drought in 35 years has also caused the Brazil's larger and less-populated northeast to lose 49 trillion liters of water each year over three years compared with normal levels, said NASA hydrologist Augusto Getirana.
Brazilians are well aware of the drought due to water rationing, power blackouts and empty reservoirs in parts of the country but this is the first study to document exactly how much water has disappeared from aquifers and reservoirs, Getirana said.
"It is much larger than I imagined," Getirana told the Thomson Reuters Foundation. "With climate change, this is going to happen more and more often."
The Cantareira water reservoir system providing water for 8.8 million residents of Sao Paulo, Brazil's largest city, for example, was filled to less than 11% of its capacity last year, local officials reported.
Getirana's research, published this week in the Journal of Hydrometeorology, relies on 13 years of data from NASA's Gravity Recovery and Climate Experiment (GRACE) satellites which circle the earth detecting changes in the gravity field caused by movements of water on the planet. [more]

28 October 2015 (NASA Goddard) – Empty water reservoirs, severe water rationing, and electrical blackouts are the new status quo in major cities across southeastern Brazil, where the worst drought in 35 years has desiccated the region. A new NASA study estimates that the region has lost an average of 15 trillion gallons of water per year from 2012 to 2015. Eastern Brazil as a whole has lost on average 28 trillion gallons of water per year over the same time period.
Augusto Getirana, a hydrologist at NASA's Goddard Space Flight Center, in Greenbelt, Maryland, analyzed the amount of water stored in aquifers and rivers across Brazil from 2002 to 2015, interested in understanding the depth of the current drought.
A new data visualization of 13 years of GRACE data shows the distribution of water across Brazil. Blues indicate increases in water, mostly occurring in the western regions of Brazil in the rainforest. Meanwhile red and orange shows where water stores have declined, occurring mainly in the north and southeast. At the beginning of the data collection, in 2002, Brazil was just coming out of a drought that began in 2000. A wet period followed until 2012 when dry conditions set in again due to a lack of precipitation and higher than usual temperatures, according to supplemental data.
Southeastern Brazil was hardest hit by drought conditions, said Getirana. To make matters worse, Brazil relies on rivers that feed into reservoirs and dams that generate about 75% of the electrical power for the country. By September 2014, for example, the Cantareira reservoir system that provides water for 8.8 million people in São Paulo's metro region reported that it was filled to 10.7% of its total capacity, a situation that has led to major water rationing.
Research: Extreme water deficit in Brazil detected from space.
Journal: Hydrometeorology, 27 October 2015.
Link to paper: Extreme water deficit in Brazil detected from space
Here is the YouTube video.
Additional footage from: Itaipu Binacional Files.
http://www.desdemonadespair.net/2015/11/new-nasa-study-shows-brazils-drought.html 

John Abraham: Study drives a sixth nail into the global warming ‘pause’ myth

Numerous climate records and denial myths have fallen in 2015

Road markings appear distorted during a heatwave, in New Delhi, India, 27 May 2015.

Road markings appear distorted during a heatwave, in New Delhi, India, 27 May 2015. Photograph: Harish Tyagi/EPA

by John Abraham, "Climate Consensus - The 97%," The Guardian, November 24, 2015

Despite the organization and funding behind groups which try to cast doubt about the causes and implications of climate change, the facts have spoken. The world continues to warm and their favorite myths have died.
We know that human-emitted heat-trapping gases warm the planet. In fact, this has been known for well over a century. With modern instruments (like ocean thermometers and satellites among others), we are now measuring the change. With advanced climate models, we can predict the changes. The measurements and the predictions are in excellent agreement, despite what cable news and second-rate skeptical scientists say.
And this year, the data are in. Using measurements to date, and long-term weather forecasting to predict the last 40 days of the year (while it may seem a bit early) we now know. As my colleague Dana Nuccitelli recently noted, 2015 is the hottest year on record. When the final numbers come out in January, the NOAA 2015 global averaged surface temperature anomaly over both land and ocean will be 1.6 °F above the long-term average. For the NASA GISTEMP dataset, it will be 1.5 °F above the long-term average. This comes on the heels of last year’s record and recent record ocean heat content. So, the bad news is we continue to break records.
The good news is that the favorite myths from climate-change skeptics [deniers] have taken a beating this year. Perhaps the best-known myth is the so-called “pause” or “hiatus” in global warming. This year, six individual studies have looked into this and found it incorrect. I have co-authored one of the studies, and I’ve written about some of the others here and here.
Well just today, another paper was published by Stephan Lewandowsky, James Risbey, and Naomi Oreskes that comes to the same conclusion. The paper is titled, “On the definition and identifiability of the alleged 'hiatus' in global warming.” The authors assess the magnitude and significance of all possible warming trends during the past 30 years. They found that looking back in time, the current definition of a “pause” in warming, as it is used in the literature, would have been used for more than one-third of the time, even though temperatures during the past 30 years increased by 1.1 °F (0.6 °C). 
The authors included 40 peer-reviewed studies that reported on the so-called hiatus or pause, and found no consistent definition among those studies. Then, the authors used these same 40 papers and asked whether the so-called “hiatus” was unusual in the time records. They found it wasn’t. 
The study also found that when the sample size is small (such as a short time period with very few years), a so-called “hiatus” will always appear. For instance, anyone claiming a “hiatus” shorter than 12 years will almost always find one.
I asked author Naomi Oreskes for a summary and she told me,
For a long time, climate change contrarians and deniers have insisted that global warming has paused, stopped, or taken a hiatus. This might have been dismissed as the usual denier cherry-picking—since much of it was based on cherry picking the starting year of 1998—an unusually hot year.
So we took up the question, first of all, whether the warming had stopped and second, if it had not, why were scientists calling it a pause. Ironically the paper that answered the second question got published first: we showed how contrarian discourse had steeped into the climate science community, so scientists were calling this decrease in the rate of warming a pause, when it clearly was no such thing. If warming continued, as indeed it did, then by definition that is not a pause, nor a hiatus. Our new paper, shows statistically that not only has there not been a pause or hiatus, but that the observed rate of warming is well within the range of previous fluctuations—including some positive fluctuations (i.e. increases in the rate of warming) that did not generate any scientific attention.
So the bottom line is: there is no pause, and there has never been one. The rate of global warming does fluctuate—but this has been known for a long time. Whether or not any particular fluctuation has an identifiable cause—like the effects of ocean heat uptake or an El Ninois an interesting question, but a fluctuation is not a pause, and it is important to be clear that the recent fluctuation is not statistically anomalous compared with other fluctuations we have seen, relative to the longer-term warming trend.
Now, with six nails in this coffin of this myth, are any more needed?
http://www.theguardian.com/environment/climate-consensus-97-per-cent/2015/nov/24/study-drives-a-sixth-nail-in-the-global-warming-pause-myth

MUST SEE VIDEO OF JEREMY GRANTHAM! [Excerpt] speaking at the 'Secretary's Climate and Clean Energy Investment Forum'


https://www.youtube.com/watch?v=Xhdn8LRpC2g

Sergey Zimov: One small way to help preserve Siberian permafrost -- introduce large grazing herbivores to flatten out the snow and recreate steppe grassland ecosystem

Rescuing the Russian permafrost

Two scientists in Siberia have discovered why the Arctic permafrost is melting. They say reintroducing millions of bison and elk to the steppe ecosystem could help stop global warming.


Watch video07:10
    http://www.dw.com/en/rescuing-the-russian-permafrost/av-18876625

    Pleistocene rewilding:

    Pleistocene Park (RussianПлейстоценовый парк) is a nature reserve on the Kolyma River south of Chersky in the Sakha RepublicRussia, in northeastern Siberia, where an attempt is being made to recreate the northern subarctic steppe grassland ecosystem that flourished in the area during the last glacial period.[1]
    The project is being led by Russian researcher Sergey Zimov,[2] with hopes to back the hypothesis that overhunting, and not climate change, was primarily responsible for the extinction of wildlife and the disappearance of the grasslands at the end of the Pleistocene epoch.[3][4]
    A further aim is to research the climatic effects of the expected changes in the ecosystem. Here the hypothesis is that the change from tundra to grassland will result in a raised ratio of energy emission to energy absorption of the area, leading to less thawing of permafrost and thereby less emission of greenhouse gases.[3][4]
    To study this, large herbivores have been released, and their effect on the local fauna is being monitored. Preliminary results point at the ecologically low-grade tundra biome being converted into a productive grassland biome, and at the energy emission of the area being raised.[5]
    A documentary is being produced about the park by an American journalist and filmmaker.[6][7]

    Study finds evidence for a climate-change regime shift in the 1980s

    Climate study finds evidence of global shift in the 1980s

    Anthropogenic warming, volcanic eruption sparked biggest change in 1,000 years


    from ScienceDaily, November 24, 2015

    Summary:  Planet Earth experienced a global climate shift in the late 1980s on an unprecedented scale, fueled by anthropogenic warming and a volcanic eruption, according to new research. Scientists say that a major step change, or 'regime shift,' in Earth's biophysical systems, from the upper atmosphere to the depths of the ocean and from the Arctic to Antarctica, was centered around 1987, and was sparked by the El Chichón volcanic eruption in Mexico five years earlier.
    Volcano (stock image). Human-made warming and volcanic eruption in the 1980s fuelled the biggest change in 1,000 years, say scientists.
    Credit: © beppulos / Fotolia
    Planet Earth experienced a global climate shift in the late 1980s on an unprecedented scale, fuelled by anthropogenic warming and a volcanic eruption, according to new research published this week.
    Scientists say that a major step change, or 'regime shift,' in Earth's biophysical systems, from the upper atmosphere to the depths of the ocean and from the Arctic to Antarctica, was centred around 1987, and was sparked by the El Chichón volcanic eruption in Mexico five years earlier.
    Their study, published in Global Change Biology, documents a range of associated events caused by the shift, from a 60% increase in winter river flow into the Baltic Sea to a 400% increase in the average duration of wildfires in the Western United States. It also suggests that climate change is not a gradual process, but one subject to sudden increases, with the 1980s' shift representing the largest in an estimated 1,000 years.
    Philip C. Reid, Professor of Oceanography at Plymouth University's Marine Institute, and Senior Research Fellow at the Sir Alister Hardy Foundation for Ocean Science (SAHFOS), is the lead author of the report, Global impacts of the 1980s' regime shift.
    "We demonstrate, based on 72 long time-series, that a major change took place in the world, centred on 1987, that involved a step change and move to a new regime in a wide range of Earth systems," said Professor Reid.
    "Our work contradicts the perceived view that major volcanic eruptions just lead to a cooling of the world. In the case of the regime shift it looks as if global warming has reached a tipping point where the cooling that follows such eruptions rebounds with a rapid rise in temperature in a very short time. The speed of this change has had a pronounced effect on many biological, physical and chemical systems throughout the world, but is especially evident in the Northern temperate zone and Arctic."
    Over the course of three years, the scientists -- drawing upon a range of climate models, using data from nearly 6,500 meteorological stations, and consulting innumerable scientists and their studies round the world -- found evidence of the shift across a wide range of biophysical indicators, such as the temperature and salinity of the oceans, the pH level of rivers, the timing of land events, including the behaviour of plants and birds, the amount of ice and snow in the cryosphere (the frozen world), and wind speed changes.
    They detected a marked decline in the growth rate of CO2 in the atmosphere after the regime shift, coinciding with a sudden growth in land and ocean carbon sinks -- such as new vegetation spreading into polar areas previously under ice and snow. And they found that the annual timing of the regime shift appeared to have moved regionally around the world from west to east, starting with South America in 1984, North America (1985), North Atlantic (1986), Europe (1987), and Asia (1988).
    These dates coincide with significant shifts to an earlier flowering date for cherry trees around Earth in Washington, DC, Switzerland, and Japan and coincided with the first evidence of the extinction of amphibians linked to global warming, such as the harlequin frog and golden toad in Central and South America.
    Second author Renata E. Hari, Eawag, Dübendorf, Switzerland, said: "The 1980s regime shift may be the beginning of the acceleration of the warming shown by the IPCC. It is an example of the unforeseen compounding effects that may occur if unavoidable natural events like major volcanic eruptions interact with anthropogenic warming."

    Story Source:
    The above post is reprinted from materials provided by University of Plymouth. The original item was written by Andrew Merrington. Note: Materials may be edited for content and length.

    Journal Reference:
    1. Philip C. Reid, Renata E. Hari, Grégory Beaugrand, David M. Livingstone, Christoph Marty, Dietmar Straile, Jonathan Barichivich, Eric Goberville, Rita Adrian, Yasuyuki Aono, Ross Brown, James Foster, Pavel Groisman, Pierre Hélaouët, Huang-Hsiung Hsu, Richard Kirby, Jeff Knight, Alexandra Kraberg, Jianping Li, Tzu-Ting Lo, Ranga B. Myneni, Ryan P. North, J. Alan Pounds, Tim Sparks, René Stübi, Yongjun Tian, Karen H. Wiltshire, Dong Xiao, Zaichun Zhu. Global impacts of the 1980s regime shiftGlobal Change Biology, 2015; DOI: 10.1111/gcb.13106

    Saturday, November 28, 2015

    Peter Sinclair, Climate Crocks: Why New NOAA Temps are More Reliable

    by Peter Sinclair, Climate Crock of the Week, November 28, 2015

    Figure 1
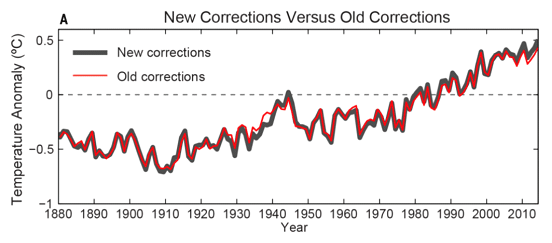
    Figure 1. New and old homogenized global land/ocean records from Karl et al., 2015.

    The current (#lamarlysenko) climate denial witch hunt being conducted by Lamar Smith and the House Science Committee was triggered by the publication of several new papers which have put to rest one of denial-dom’s favorite nonsense memes – that “temperatures have not been rising” for x years.
    In particular, the paper by Thomas Karl and colleagues at NOAA has been a target, so it’s worth reviewing what the NOAA group wrote about.  In a nutshell  they tapped into some more reliable data.

    Significant recent media and political attention has been focused on the newNOAA temperature record, which shows considerably more warming than their prior record during the period from 1998 to present. The main factor behind these changes is the correction in ocean temperatures to account for the transition from ship engine room intake measurement to buoy-based measurements and a calibration of differences across ships using nighttime marine air temperatures (NMAT). Here we seek to evaluate the changes to the NOAA ocean temperature record by constructing a new buoy-only sea surface temperature record. We find that a record using only buoys (and requiring no adjustments) is effectively identical in trend to the new NOAA record and significantly higher than the old one. 
    The changes to the prior NOAA global land/ocean temperature series are shown in Figure 1. There are some large changes in the 1930s that are interesting but have little impact on century-scale trends. The new NOAA record also increases temperatures in recent years, resulting a in a record where the period subsequent to 1998 has a trend identical to the period from 1950-1997 (and giving rise to the common claim that the paper was “busting” the recent slowdown in warming). 
    The paper that presented the revised record, Karl et al., didn’t actually do much that was new. Rather, they put together two previously published records: an update to the NOAA sea surface temperature record (called ERSST) from version 3 to version 4, and the incorporation of a new land record from the International Surface Temperature Initiative (ISTI) that makes use of around 32,000 land stations rather than the 7,000 or so GHCN-Monthly stations previously utilized. The new land record is quite similar to that produced by Berkeley Earth, though it has relatively little impact on the temperature trend vis-à-vis the old land record, particularly during the recent 1998-present period. 

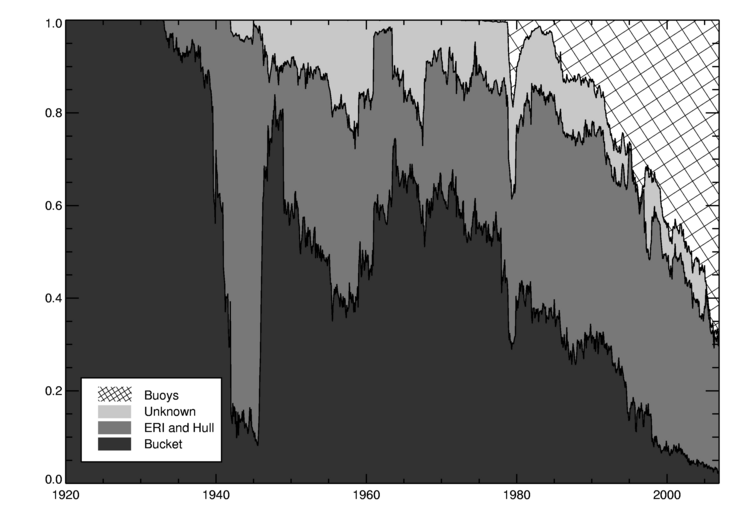
    The slowdown-busting nature of the Karl et al paper relies almost entirely on the update from ERSST v3b to v4. During the post 1998 period, this is primarily due to a revised treatment of buoys and ship engine room intake (ERI) measurements and an improved calibration of differences across ships. During the past few decades the number of automated SST measurement buoys has expanded rapidly from effectively zero before 1980 to over 70% of all SST measurements today as shown in the figure below. Buoys are appealing measurement platforms, as they are not restricted to shipping routes and often have fully automated reporting via satellite uplink.
    Figure 2
    Figure 2. Share of SST observations by instrument type from Kennedy et al., 2011. Note that this figure ends in 2006; since then buoys have continued to grow in observation share.
     
    NOAA argues that the transition to buoys introduced a spurious cooling bias into the record. ERIs tend to warm the water a bit before measuring it (ship engine rooms being rather hot), whereas buoys do not. They identify a bias of around 0.1 C between buoys and ERIs and remove it by adjusting buoy records up to match ERI records in ERSST v4, as well as use NMAT readings to calibrate the differences across ships. These adjustments had not been done in the priorERSST v3b. As an aside, the decision to adjust buoys up to ERIs or ERIs down to buoys should nominally be trend neutral. Indeed, in their work on HadSST3 Kennedy and colleagues explicitly tested this, and found “no appreciable difference” on trends. 
    However, there is a rather straightforward way for us to test if the adjustments done in ERSST v4 are proper or not: compare their adjusted record to a record made only from buoys. The buoy records are from purpose built instruments which are largely standardized, resulting in much more homogeneous record [details]. On the other hand, the buoy record is short, and has limited coverage in the early 1990s. 
    The buoy-only record is prepared by calculating daily averages for each buoy. Buoys which show a large daily temperature variation are rejected: in deep water the daily temperature range is only a few tenths of a degree, but in very shallow water it can be substantial which presents problems when some data are missing. Next, the daily data are placed into 550 x 550 km equal area grid cells based on the location of the buoy for that day, and monthly averages are determined for each cell. 
    The resulting coverage is still limited and so produces a biased estimate of global sea surface temperature. To produce a useful comparison to ERSST, we therefore reduce the coverage of the ERSST datasets to match the buoy dataset (now using a fine 1-degree grid for all the data) and then calculate anomalies for all the datasets using a 2001-2010 baseline. The area weighted mean temperature is then calculated for each record. While this doesn’t provide a very good estimate of global SST, it does allow a strict like-with-like comparison against ERSST over the regions where the buoys have coverage. The percent of global ocean covered by buoy measurements varies from around 40% in the mid 1990s to around 70% in recent years. 
    Figure 3
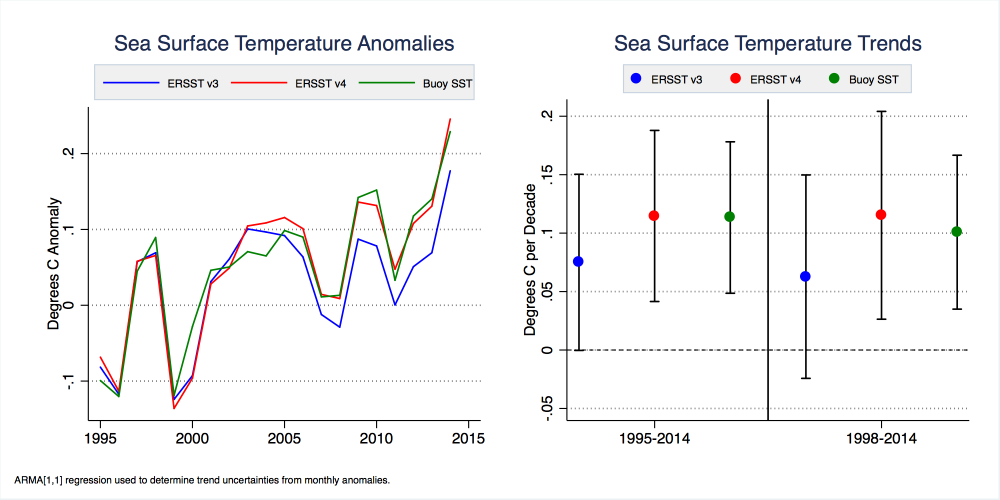
    Figure 3. ERSST v3b, v4, and Buoy-Only SST anomalies and trends from 1995 through the end of 2014. The trend periods shown are the full record (1995-2014) and the “hiatus” period (1998-2014). 2015 is excluded as the year is incomplete, and the period prior to 1995 is excluded due to limited buoy coverage. The anomaly graph is baselined to 1995-2005 to show the time-evolution of differences.
     
    As shown in Figure 3, a buoy-only record is quite similar to the ERSST v4 but shows statistically significantly more warming than ERSST v3b during the period from 1995 through the end of 2014 (p < 0.05 trend in the differences). This suggests that ERSST v3b suffered a cooling bias when blending buoy and ship records that is properly corrected in ERSST v4, at least for the areas where both ship and buoy records are available. Because the buoy record is relatively homogeneous and requires no adjustments, it provides a good check in the validity of the combined ship-buoy series when normalized for spatial coverage. 
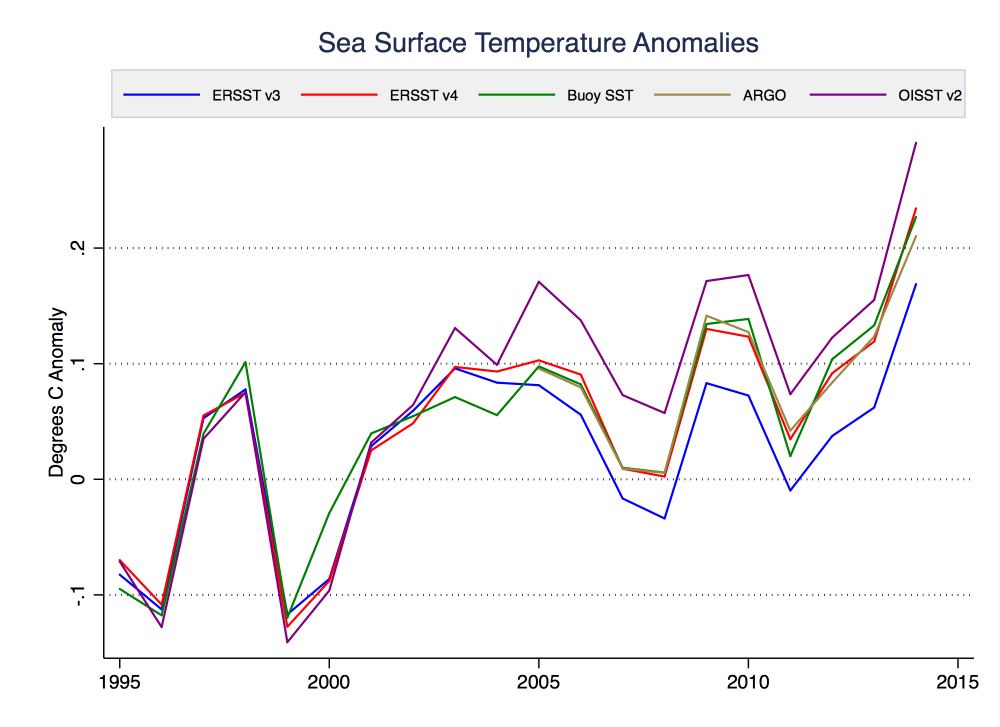
    In addition to the buoy-only dataset, we can also examine data from ARGO floats (which are not included in our buoy dataset). The ARGO floats have fairly good spatial coverage over the period since 2005. They are primarily intended to measure deep ocean temperatures, but also measure sea surface temperatures during their ascent from the depths to the surface. NOAA provides another sea surface dataset called OISST, which includes data from ships, buoys, and satellites. There are two versions of OISST: a daily version which is newer and includes adjustments to account for the transition from ships to buoys, and a weekly version which does not include this correction. Figure 4 shows how both the ARGO record and daily OISST record compare to ERSST v3b, v4, and our new buoy-only record when spatial coverage is normalized across all records.
    Figure 4
    Figure 4. ERSST v3b, v4, and buoy-only, ARGO, and OISST SST anomalies from 1995 through the end of 2014. The anomalies shown are relative to a 1995-2005 period; the ARGO record is too short for this baseline and instead is matched to the buoy-only record during the period of overlap.
     
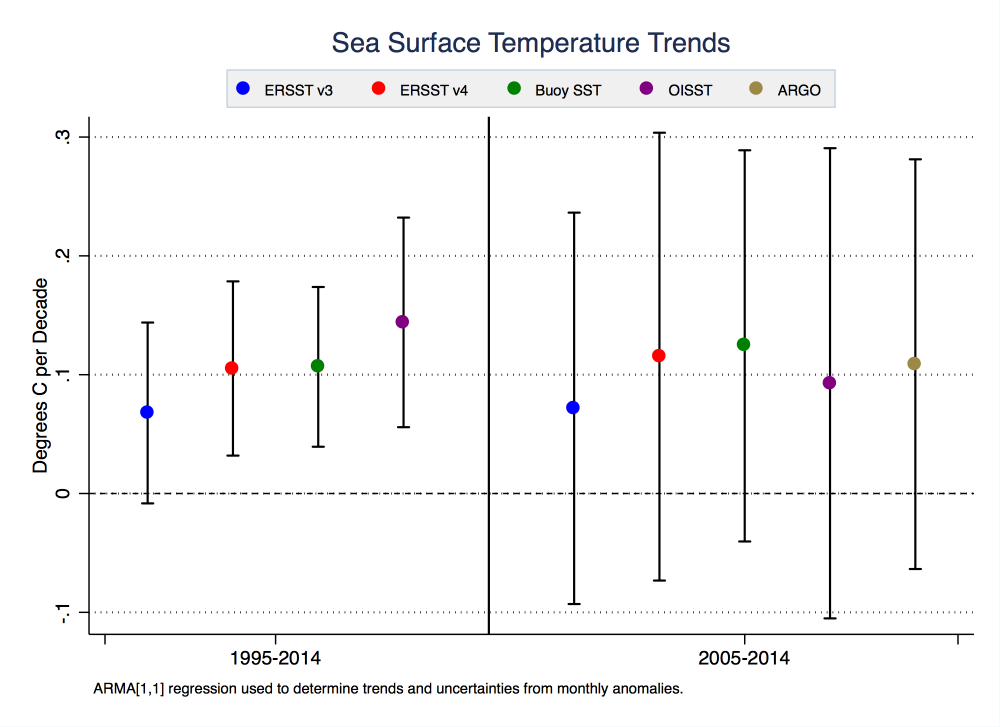
    Over the period from 2005 to 2014, ARGO buoys show statistically significantly more warming than ERSST v3b (p < 0.05 using an ARMA[1,1] model), but indistinguishable from ERSST v4 or the buoy-only record. Similarly, OISST has the highest trend of all series over the 1995-2014 period. The trends of all series over these two periods are shown in Figure 5. 
    Figure 5
    Figure 5. ERSST v3b, v4, and buoy-only, ARGO, and OISST SST trends from 1995-2014 and 2005-2014. The latter period is chosen to compare ARGO to other records, as the ARGO record does not have sufficient coverage prior to 2005. Confidence intervals are calculated using an ARMA [1,1] model to account for autocorrelation. Note: the confidence intervals indicate the uncertainty in the trends, which is dominated by interannual variability. The uncertainty in the trend in the differences is much lower, leading to a statistically significant difference between the buoys and ERSSTv3b.
     
    The ship records are important because they form the foundation for a long sea surface temperature record, but they require careful calibration. The differences between HadSST3 and ERSSTv4 suggest that the finer details of the ship record are not yet settled, and as a result care is required especially when considering short term trends. 
    However the buoy data, ARGO floats, and daily OISST record all support the NOAA claim that ERSSTv3b suffered a significant cool bias over recent years arising from inhomogeneities in the ship record and the increasing use of buoys Code for downloading and processing the data for this analysis is available here: http://www.ysbl.york.ac.uk/~cowtan/data/buoy.zip. While the code and data are only 18 MB, the (optional) raw buoy data are approximately 44 GB. Gridded 1×1 files are also provided for buoy, ERSSTv3b, and ERSSTv4 data.
    http://climatecrocks.com/2015/11/28/why-new-noaa-temps-are-more-reliable/

    COP 21: Scientists identify a worldwide pattern of climate change in the late 1980s as the early signpost that has now led to the crucial UN summit in Paris

    by Tim Radford, Climate News Network, November 27, 2015

    LONDON – Climate change may have begun more than 25 years ago. At around the time that global warming and the spectre of climate change first emerged as a geopolitical challenge for future generations, it had already commenced, according to new research.

    As world leaders gather in Paris for COP21, the UN summit seeking to get a global agreement on responses to climate change, British oceanographers and colleagues from around the world have identified a “major change in the Earth’s biophysical systems” in the late 1980s.

    They looked back into recent climate history, and now say that the change can be attributed to “rapid global warming from anthropogenic plus natural forcing.”

    Climate scientists have been warning for decades that the build-up of greenhouse gases in the atmosphere, as a result of the human combustion of fossil fuels, will at some point tip stable climate zones into new regimes – a shift defined by the researchers as an “abrupt, substantial and persistent” change.

    Most climate scientists expect such change to happen in the next few decades, but this new study seems to declare that it has already started to happen.

    Cause and effect

    The scientists report in Global Change Biology journal that they have identified a worldwide pattern of change, centred around 1987, that was seemingly associated with the eruption of Mexico’s El Chichón volcano in 1982.

    Analyses such as these are complex. No single weather event can be taken as significant, while cause and effect also are not easily linked.

    But the researchers are sure they have found a significant pattern emerging from a huge range of records − from cherry blossom times in Japan, Washington, DC, and Switzerland, to grape-ripening dates in Germany, and from the arrival of the migrant sand martins in the UK to the duration of wildfires in the western US.

    “We demonstrate, based on 72 long time series, that a major change took place in the world centred on 1987 that involved a step change and move on to a new regime in a wide range of Earth systems,” says the study’s lead author, Philip “Chris” Reid, professor of oceanography at Plymouth University’s Marine Institute in the UK.

    “Our work contradicts the perceived view that major volcanic eruptions just lead to a cooling of the world. In the case of a regime shift, it looks as if global warming has reached a tipping point where the cooling that follows such eruptions rebounds with a rapid rise in temperature in a very short time.

    “The speed of this change has a pronounced effect on many biological, physical and chemical systems throughout the world, but is especially evident in the Northern temperate zone and the Arctic.”

    Any research that “contradicts a perceived view” is likely to be examined, challenged and countered by other climate scientists. One study will not settle the argument, but observers with long memories will recognise that this hindsight evidence for climate regime shift coincides with the moment that climate change emerged as a political subject in 1988.

    During a prolonged drought and devastating heatwave that summer in the US and Canada, the then NASA scientist James Hansen warned a US senate committee: “It’s time to stop waffling so much and say the evidence is pretty strong that the greenhouse effect is here.”

    Marked decline

    Professor Reid and his colleagues have now detected a marked decline in the growth rate of carbon dioxide after the regime shift, coinciding with the growth of new vegetation on land and sea that had once been under ice and snow.

    They found that the annual timing of the regime shift moved around the world from west to east, starting with South America in 1984, North America a year later, the north Atlantic in 1986, Europe in 1987, and Asia in 1988.

    Data from the time series embraces a huge range of systematically-measured events, such as the temperature of rivers in Switzerland, the mass of phytoplankton in the North Sea, and the Japan Sea tuna catch.

    During this period, the winter river flow into the Baltic increased by 60%, and the average duration of wildfires in the western US increased fourfold. The scientists estimate that the shift in the 1980s was the largest in a thousand years.

    The researchers conclude that the shift they perceive will affect how the seas, forests and wetlands soak up carbon from the atmosphere, a key factor in continuing climate change.

    “The wide range of changes associated with the 1980s regime shift supports a threshold thesis that moved the whole global system into a new, rapidly warming state, with compounding consequences,” they say. 

    James Hansen: Isolation of 1600 Pennsylvania Avenue: Part I

    by James Hansen, November 27, 2015

    Earlier this year I received a message from a long-time reader of my Communications[1], who was persuaded of the urgency of the climate problem. As a significant supporter of the Democratic Party, he had the opportunity to meet President Obama, and he was preparing a specific question: would the President be willing to “meet with Jim Hansen,” who, the supporter asserted, understood the problem as well as anyone and has “some viable ways to fix the problem”?

    Obama’s response: he had already read my stuff (presumably meaning my book [2]), but would be interested in talking if it were about policy (presumably meaning that he was already convinced about the reality of the science).  My response to the supporter was that we should check whether the offer was real after my long-overdue “Ice Melt” paper was submitted for publication.

    This summer, after submitting the paper, my supporter tried valiantly, but dolefully reported that he could not get through, the President was too well protected.  Not so easily deterred, I reported the matter to Obama’s Science Adviser, John Holdren, and sent him my Ice Melt paper.  Holdren responded that it was a valuable paper, but he ignored my request to meet the President.

    So who does the President listen to?  It is worth revealing.  But first let’s note facts that must be included in honest capable advice.  China now has the largest fossil fuel emissions (Fig. 1a).  U.S. emissions are dwindling a bit, and they will continue to be a decreasing portion of ongoing global emissions.  India, the #3 emitter behind the U.S., is moving up fast.
    However, human-caused climate change is not proportional to current emissions; instead, climate change depends on cumulative emissions[3]

    CO2 from early emissions is now largely incorporated into the ocean and biosphere, but it had a longer time to affect climate, compensating for the small fraction remaining in the air today.  Stated differently, the date of burning is irrelevant because of the millennial lifetime in the Earth system of CO2 released in burning of fossil fuels.

    We see (Fig. 1b) that the U.S. is responsible for more than a quarter of global climate change.  Europe is also responsible for more than one quarter.  China is responsible for about 10%, India for 3% and so on.  However, even Fig. 1b is misleading about responsibilities.

    Fig. 1.  Annual 2014 and cumulative (1751-2014) fossil fuel CO2 emissions

    Fig. 1.  Annual 2014 and cumulative (17512014) fossil fuel CO2 emissions (CDIAC data, BP updates).[4]

    Fig. 2.  Per capita cumulative (1751-2014) fossil fuel CO2 emissions4 based on 2010 populations.
    Fig. 2.  Per capita cumulative (17512014) fossil fuel CO2 emissions4 based on 2010 populations.

    Per capita responsibility for climate change (Fig. 2) has the UK, where the industrial revolution began, as most responsible, followed closely by the U.S. and Germany.  Chinese responsibility is an order of magnitude smaller and India’s share is barely visible (Fig. 2).

    Another crucial fact is that we have already burned most of the carbon that we can afford to put into the climate system[5],[6] (even under the flawed proposition that 2 °C global warming is a safe “guard rail”).  In other words, the West burned most of the world’s allowable carbon budget.

    The scientific community agrees on a crucial fact: we must leave most remaining fossil fuels in the ground, or our children and future generations are screwed.  Yet Obama is not proposing the action required for the essential change in energy policy direction, even though it would make economic sense for developed and developing countries alike, especially for the common person.

    How can such miserable failure of political leadership be explained, when Obama genuinely wants climate policy to be one of his legacy issues?  Don’t blame it on the fossil fuel industry; many industry leaders are beginning to say sensible things about the direction needed.  And Obama is in his final political office – he could act – he does not need oil industry money.

    My thesis is that Obama actually means well, has some gumption, and wants effective actions to be taken, but he is being very poorly advised.  As a result, people at the working level have been given no effective direction and are producing little.  Mostly they are working on spin.

    Get ready for the great deceit and hypocrisy planned for December in Paris.  Negotiators do not want the global leaders to look like fools again, as they did in Copenhagen.  They are determined to have leaders clap each other on the back and declare the Paris climate negotiations a success.

    A prelude of Paris deceit is shown by Chart 3, a press conference with John Podesta, once czar of Obama’s climate policy, and Energy Secretary Ernie Moniz.  They express optimism on the Paris summit, citing an agreement of the U.S. and China to work together to develop carbon capture and storage (CCS). That spin is so gross, it is best described as unadulterated 100% pure bullshit.

    I am not criticizing Ernie Moniz, an exceptional Energy Secretary who did yeoman service in negotiations to limit nuclear weapons proliferation.  I am only pointing out the dishonest spin that is being put on total failure to address the fundamental issue.

    China and India coal use is the main source of growing global COemissions (Fig. 4), but China and India are not going to attach carbon capture and storage to their thousands of coal plants, which would be hugely expensive.  We (the West) used coal and other fossil fuels to raise our
    Chart 3.  Excerpt from news article (The Hill, 24 August 2015).
    Chart 3.  Excerpt from news article (The Hill, 24 August 2015).

    standard of living, without capturing the CO2 – and in the process we burned much of China and India’s fair share of the global carbon budget.  If that means China and India must capture CO2, the West should pay the cost – but we know that is not going to happen either.

    Solution requires realistic definition of the problem.  The fundamental fact is that fossil fuels are the cheapest energy for developing countries, providing the best chance to raise people from poverty to a higher standard of living.  China uses coal for that purpose, as does India, and they will continue to do so.  Climate goals and targets will not change that fact.

    However, fossil fuels appear cheapest to the consumer only because they do not incorporate their costs to society, including the effects of air pollution, water pollution and climate change.  Economies are more efficient if energy prices are honest, including external costs in the price.

    A consequence of this fundamental truth is that climate change can be addressed at no net cost, indeed with economic gain, provided that true costs are added into the price gradually.  A simple

    Fig. 4.  Fossil fuel and cement CO2 emissions of China and India by fuel source
    Fig. 4.  Fossil fuel and cement CO2 emissions of China and India by fuel. source4.  There are uncertainties in both the coal use rate and the carbon content of the fuel, as discussed elsewhere.

    transparent way to do this is to collect an across-the-board (oil, gas, coal) carbon fee at domestic mines and ports of entry.  If the funds collected are given in equal amount to all legal residents, the fee is revenue neutral and spurs the economy.  This is a conservative approach, because it allows the market to assist change and it does not provide a dime to make government bigger.

    Such a common sense approach has not been tried by any government.  Instead legislation is proposed by liberal governments who want funds for bigger government or programs such as renewable energy subsidies.  A carbon tax is hidden in “cap-and-trade-with-offsets,” yielding higher energy prices, more government controls, and a burden on the public and businesses.  The proposed bill in the United States (Waxman/Markey) included 3500 pages of giveaways to every lobbyist who could raise his arm to write a paragraph that was then stapled into the bill.

    I have suggested, asked, or begged lawmakers, in more nations and states than I can remember, to consider a simple, honest, rising carbon fee with all funds distributed to legal residents.  Instead, invariably, if they are of a bent to even consider the climate issue, they propose the discredited ineffectual cap-and-trade-with-offsets (C&T) with all its political levers.

    In my frustration, I describe C&T as half-assed and half-baked, which is an accurate assessment if the objective is a formulation that can address the global climate problem.  C&T is half-assed, because there is no practical way to make it global as it requires individual adoption by 190 nations, and half-baked because there is no enforcement mechanism.

    In contrast, a carbon fee would require agreement of only a small number of the major economic powers, for example, the United States and China.  Upon agreement, they would place a border duty on products from nations without an equivalent carbon fee, and they would give fee rebates to domestic manufacturers for exports to non-participating nations.  This would be a huge incentive for other nations to have an equivalent carbon fee, so they could collect it themselves.

    Why would conservatives in the U.S. agree to a carbon fee?  Utility and oil industry executives and other “captains of industry” that I have encountered in the past two decades invariably approve of such an approach – indeed, utility CEOs almost beg for such simple guidance for their investments, rather than more government prescriptions and regulations.  It is not necessary to destroy capitalism to fix the climate – most captains of industry want to be part of the solution.

    Would China be willing to impose a domestic carbon fee?  China has little responsibility for global climate change (Fig. 2) and will surely give first priority to raising its living standards.  Same for India.  They have every right to do that – they did not cause the climate problem.  Furthermore, raising human living standards is the best thing for the natural world, the way to reduce human population growth, putting less pressure on other species.

    But consider this.  China and India have huge air pollution problems from burning of fossil fuels.  They also stand directly in the path of some of the greatest impacts of climate change, including hundreds of millions of people living near sea level.  The possibility of needing to handle millions of climate refugees, including their own citizens as well as those from Bangladesh and other low latitude countries, is a real threat.

    In such countries a carbon fee and dividend to legal residents has multiple merits.  It encourages the public to pay attention to their fossil fuel use.  The fee and dividend is progressive, with most low income people coming out ahead, because their added energy costs are outweighed by the dividend, so it addresses growing income inequality.  
    The need for a citizen to be registered to receive the dividend helps to minimize undocumented aliens.  Perhaps most important, it makes

    Chart 5.  Excerpt from news article (Reuters, 28 October 2015).
    Chart 5.  Excerpt from news article (Reuters, 28 October 2015).
    citizens feel that they are part of the solution – instead of complaining about air pollution and other woes, they have a means to help solve the problems.

    Fee-and-dividend is not a panacea, many other things are required including smart technology development, but a rising carbon fee and dividend is the required underpinning, the sine qua non.  Economic studies show that in the United States fee-and-dividend would decrease carbon emissions by 30% in 10 years and more than 50% in 20 years, while increasing GNP and creating more than 3 million new jobs.[7],[8]

    Don’t be misled by some economists or pseudo-economists who say, oh let’s do something better than giving 100% dividends, let’s reduce some other tax.  The public will not buy that one.  And soon it would be forgotten what tax was reduced, people would demand that the carbon tax be removed or at least not rise – because the carbon fee is a tax if there is not 100% dividend.

    How do we know that a “cap” approach can never solve the climate/fossil fuel problem?  You must beg 190 nations to each set a low cap.  What is India’s cap?  Why would India accept a low cap, when they have not caused the climate problem (Fig. 2)?  But for illustration, let’s say that miraculously India agreed to have a low carbon cap across all carbon sources (even though caps are never across-the-board on all fossil fuels at the source).  What would be the effect of that success?  It would reduce demand for the fossil fuels, making them cheaper, thus facilitating their use in other places.  The solution is a carbon fee that is made near-global via border duties.

    The Threat of a Bad Paris Accord

    The danger is that Paris will lay a Kyoto.  That is the easy way out.  Each country promises to do better, but there is no global carbon fee. Fossil fuels remain cheap. Someone keeps burning them.

    Understandably, developing countries focus on near-term support to deal with climate impacts, as they have done little to cause climate change but stand to be hit hard.  It makes sense to provide funds, because cooperation of developing countries is needed to sequester carbon via improved forestry and agricultural practices, and to limit trace gas emissions.  Mutual needs can make this work, with payments contingent on cooperation and success in each program.

    However, we cannot let developed countries use these payments to buy business-as-usual.  The future of people in all countries requires rapid phasedown of fossil fuel emissions. An across-the-board carbon fee is needed to achieve rapid emissions reduction, avoiding the Kyoto debacle.
    Yet UN climate chief, Christiana Figueres declares that the Paris accord will not include a carbon price (Chart 5).  “(Many have said) we need a carbon price and (investment) would be so much easier with a carbon price,” Figueres said, “but life is much more complex than that.”

    Baloney.  A flat carbon fee is too complex?  Figueres deserves our respect and thanks for hard work, but we cannot let politeness damage the future of our planet and loved ones.

    I know the “complexity” Figueres encounters with global leaders, notably German Chancellor Angela Merkel[9].  Merkel is suggesting that others adopt the German approach: close nuclear power plants, subsidize renewables, reduce emissions via resulting high electricity prices and a cap & trade scheme, and export production of many products for domestic consumption to other countries (where fossil fuels may be used).  Result: global emissions decline little, if at all.

    Germany is providing a valuable experiment.  Can a wealthy nation with exceptional engineering ability and a public willing to subsidize renewable energies rapidly phase out carbon emissions?

    However, it is a mistake to assume that all other nations will follow the German example or even that this approach leads to carbon-free electricity, which is the fundamental technical requirement for phasing out CO2 emissions.  Indeed, it is disquieting that Germany is building coal-fired power plants and other nations are building gas-fired power plants.  If this continues, the “technology lock-in” from long-lived power plants could guarantee expanded fracking and high CO2 emissions through most of this century.

    The danger that Paris may mimic Kyoto is heightened by the “guard rail” concept, which allows governments to promise future emission reductions rather than set up a framework that fosters rapid emissions reductions.  Climate science does not define a safe guard rail; instead science indicates that atmospheric CO2 is already into the dangerous range, as shown by a group including world experts in the carbon cycle, paleoclimate and other relevant areas.[10]

    The valid scientific message is that emissions must be reduced as rapidly as practical.  And in turn, that implies the price of fossil fuels must be made honest by adding a rising carbon fee.

    However, instead, in pre-Paris negotiations each nation is being asked how much it will reduce emissions.  These pledges are then used to estimate whether global temperature will be within the “guardrail.”
    Meanwhile low fossil fuel prices continue, guaranteeing that more fossil fuel infrastructure will be built and high emissions will continue.  Valuable time is wasted.

    Fig. 6.  Fossil fuel emissions growth this century in the 21 nations with largest current emissions

    Fig. 6.  Fossil fuel emissions growth this century in the 21 nations with largest current emissions.4

    The situation is summarized in the emissions changes of the 21 highest emitting nations (Fig. 6).  Global emissions increased almost 50% in the last 14 years.  Most developed nations achieved only small reductions, although in Italy and the United Kingdom reductions are about 25%.
    The bottom line is this: rapid reduction of global emissions is not happening without a fundamental economic drive toward clean energies.  A rising revenue-neutral carbon fee7,8 would strengthen economies.  So why should this not be pursued and be potentially achievable?

    In fact, with agreement between the United States and China, it could be achieved.  As far as I know, they have not ceded authority to a United Nations bureaucrat to decide what is possible.

    If the U.S. fails to lead, it seems unlikely that China would immediately take the lead to propose a carbon fee, given that China is not the cause of most climate change.  However, China may take leadership as their self interest in preserving climate grows, especially if bickering between political extremes continues to hamstring the United States[a].  In that case, the best hope for young people and the planet will be rational Chinese leadership, which will likely find many other nations ready to form a coalition of the willing.

    You might argue that such a diplomatic agreement would never be approved by conservatives (not only in the U.S., but also other nations).  I disagree.  Thoughtful conservatives, behind the scenes, are coming around to the idea of a revenue-neutral carbon fee.  Obama’s carbon regulations are of little value for reducing global emissions, but they are a useful bargaining chip for persuading conservatives to support a revenue-neutral carbon fee as a compromise.

    I do not suggest that Obama would get prompt agreement from the U.S. Senate for a Paris accord with a carbon fee.  Acceptance likely would take a number of years, but if an international framework for common domestic carbon fees is set up (with border duties on products from nonparticipating nations), pressure to join would mount as climate impacts grow.

    Compare that approach with the route Obama seems to be on.  First, note that his signature victory (EPA regulations that reduce domestic emissions), assuming that it stands up in court, amounts to only several percent of U.S. emissions, which is about one year’s growth of global emissions during the past 14 years.  Second, what is the chance that what he is proposing for Paris will fly with the U.S. Senate?  Zilch.  Even many Democrats would oppose it.  Not much better than the Clinton-Gore 97-0 blowout.  The fossil fuel industry’s ‘I am an energy voter’ campaign, energy independence, easily wins.  They would laugh all the way to the bank.

    Obama’s climate legacy, on his present course, will be worse than a miserable failure: it will be an unnecessary miserable failure.  His popularity in 2008 was 70% and his party controlled both houses of Congress.  Anniek and I wrote a letter[11] to Michelle and Barack Obama in December 2008 explaining the climate situation and needed policies, which he could have initiated then.  However, John Holdren would not deliver the letter, arguing that he would not be confirmed as Science Adviser for months.  Obama, instead, listened to Big Green.

    Big Green consists of several “environmental” organizations, including Environmental Defense Fund (EDF) and National Resources Defense Council (NRDC), each with $100+M budgets, each springing from high-minded useful beginnings, each with more high-priced lawyers than you can shake a stick at.  EDF, with purblind equation of the sulfur and carbon pollution problems, was chief architect of the disastrous Kyoto lemon.  NRDC proudly claims credit for Obama’s EPA strategy and foolishly allows it to migrate to Paris.

    Obama still has a chance at a positive climate legacy, if he ditches Big Green.  Better to sit down with the Chinese leaders, who are technically trained, rational, and understand we are together in the same boat.  We had better figure out how to plug the leaks together or we sink together.

    Watch what happens in Paris carefully to see if all that the leaders do is sign off on the pap that UN bureaucrats are putting together, indulgences2 and promises to reduce future emissions, and then clap each other on the back and declare success.

    In that case President Obama will have sold our children, and theirs, down the river.

    References

    [a] As I will discuss in Part II, it is not difficult to make a case that extreme liberals have done as much damage to the future of young people and other life on Earth as “human-made climate change is a hoax” extremists.
    [3] Hansen, J., M. Sato, R. Ruedy, P. Kharecha, A. Lacis, R.L. Miller, L. Nazarenko, K. Lo, G.A. Schmidt, G. Russell, 2007: Dangerous human-made interference with climate: A GISS modelE study. Atmos. Chem. Phys., 7, 2287-2312.
    [4] From http://www.columbia.edu/~mhs119/CO2Emissions/ with data sources there being Boden et al. (Oak Ridge National Laboratory) and British Petroleum data concatenated for most recent years.
    [5] Hansen, J., P. Kharecha, M. Sato, V. Masson-Delmotte, F. Ackerman, D.J. Beerling, P.J. Hearty, O. Hoegh-Guldberg, S.L. Hsu et al., 2013: Assessing “dangerous climate change”: Required reduction of carbon emissions to protect young people, future generations and nature. PLOS ONE, 8, e81648, doi:10.1371/journal.pone.0081648.
    [6] Intergovernmental Panel on Climate Change (IPCC): Climate Change 2013, Stocker, T., Dahe, Q., Plattner, G.K., et al., eds., Cambridge University Press, 1535 pp., 2013.http://www.ipcc.ch/report/ar5/wg1/#.UlCweRCvHMM.
    [8] Hansen, J.E., 2015: Environment and development challenges: the imperative of a carbon fee and dividend, in The Oxford Handbook of the Macroeconomics of Global Warming, Eds. L. Bernard and W. Semmler, Oxford University Press, doi:10.1093/oxfordhb/9780199856978.013.0026  also available www.columbia.edu/~jeh1
    [9] Eight years ago, on the advice of the Science Adviser to Merkel, I foolishly agreed to withdraw an open letter to Merkel on energy policies that was to be published in Die Zeit, instead agreeing to a trip to Berlin to discuss the matter with the German government, on the rationale that such was the way to really have an impact on policy2.
    As it turned out I only met Minister Gabriel, who promptly said that cap & trade and phase-out of nuclear power were irrevocable German policy.  The function of their 2°C “guardrail” seemed to be to allow several decades for phasing down CO2 emissions.  In response to repeated assertion that the target should be 350 ppm, not 2°C, he repeatedly said they could “tighten the carbon cap”.  In response to the question of what is the cap for India, which proves that a cap approach cannot work, he had no answer. Any serious policy discussion was successfully avoided.2
    [10] Hansen, J., M. Sato, P. Kharecha, D. Beerling, R. Berner, V. Masson-Delmotte, M. Pagani, M. Raymo, D. Royer, and J.C. Zachos, 2008: Target atmospheric CO2: Where should humanity aim? Open Atmos. Sci. J., 2, 217-231.